Assets overtake debts.
The value of assets held by Australians continues to grow faster than debts, resulting in average per capita net wealth being 30.5% higher in 2017 than it was in 2007 in inflation adjusted terms.
The first edition of the Roy Morgan Wealth Report finds that while debts have grown relative to incomes, over the last decade the value of personal assets has grown even faster. The report was drawn from over half a million in depth face-to-face interviews conducted over the decade since 2007.
Roy Morgan CEO, Michele Levine said despite the daily headlines about the risks posed by high levels of debt, after drilling down into the data, a more balanced picture emerges.
“Housing debt has grown considerably over the past ten years, but not uniformly as the data shows wealthier cohorts have shown a much greater propensity to take on debt and those investors have more ability to handle downturns than more marginal borrowers in lower-wealth segments,” she said.
“A more detailed understanding of how debt and personal wealth are distributed can help dispel some of the more simplistic fears over debt, and give a more balanced view of its relationship to wealth creation in Australia.”
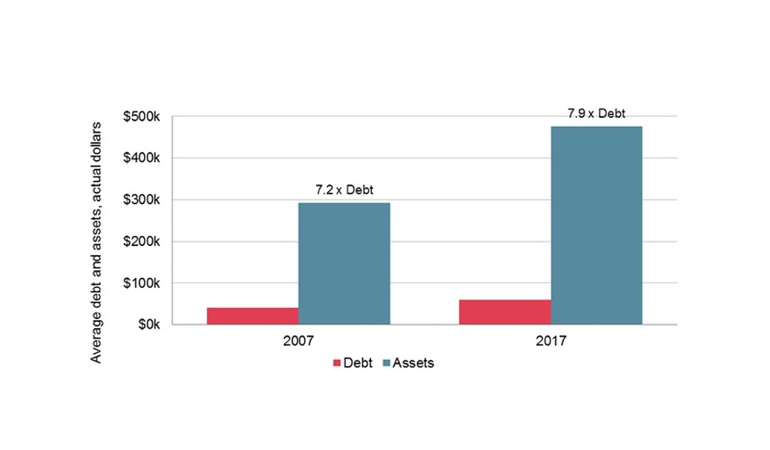
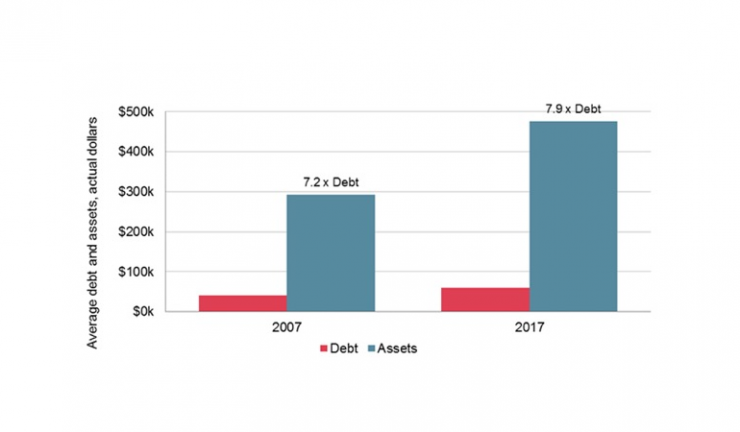
Key findings from the report show that average personal assets are now worth 7.9 times average debts, compared with 7.2 times debts a decade ago, the top 10% of Australians now have an average net wealth (assets minus debts) of $2 million and average per capita net wealth, adjusted for inflation, is 30.5% higher than it was before the onset of the global financial crisis.
Growth in wealth has not been evenly spread, with the richest 10% of Australians holding 48.3% of net wealth in 2017 compared with 46.8% a decade ago, and the poorer half of the population holding just 3.7% of net wealth compared with 3.9% a decade ago.
However, women have improved their average net wealth position relative to men, with males now holding an average of 10.6% more than women compared to 26.5% a decade ago. Also, roughly half Australia’s personal wealth is held in housing , 51.9%, down slightly from 52.4% in 2007, while superannuation assets make up a slightly higher portion, rising from 19.6% to 21.8% of our wealth since 2007.